- Home
- Faculty Resources
- Understanding and Analyzing Program Data
Understanding and Analyzing Program Data
When test results are released, the following reports and data are made available through the approved score reporting contact at each Michigan educator preparation program. These reports and data files are for use by educator preparation program faculty and administrators. They provide information about examinees who indicated during registration that the educator preparation program should receive their test results.
The table below and the information that follows describes the reports and data files available to educator preparation programs.
| Title | Format | Release Schedule | Use |
|---|---|---|---|
| Alphabetical Score Report Roster | Printable PDF | Via secure Internet site each score reporting date by 5:00 p.m. eastern time. | View examinee test results for the reporting period |
| Institution Roster by Test | Printable PDF (attached to the Alphabetical Score Report Roster) |
Via secure Internet site each score reporting date by 5:00 p.m. eastern time. | View aggregated examinee test results for each test Review aggregate pass rate results for the educator preparation program and the state by test |
| Examinee Data File | ASCII file format | Via secure Internet site each score reporting date by 5:00 p.m. eastern time. | Download and import into educator preparation program databases or applications to view and analyze examinee test scores for the given score reporting period |
| Summary Data File | ASCII file format | Via secure Internet site each score reporting date by 5:00 p.m. eastern time. | Download and import into educator preparation program databases or applications to view and analyze test data for each test taken by at least one examinee affiliated with the educator preparation program during the given score reporting period |
| ResultsAnalyzer® | Software Application | Automatically updated 2–3 business days after results releases | View reports at the examinee and educator preparation program level Generate custom reports |
Alphabetical Score Report Roster
Description. This report includes the names of all examinees (in alphabetical order) who tested during the period indicated. For each examinee, the report provides the following information:
- last four digits of the social security number
- passing status for each test or subtest taken (P = Pass, F = Did not pass)
- scaled scores for tests and subtests not passed
- an indication of performance by subarea
- the date upon which the test was taken
Sample Alphabetical Score Report Roster
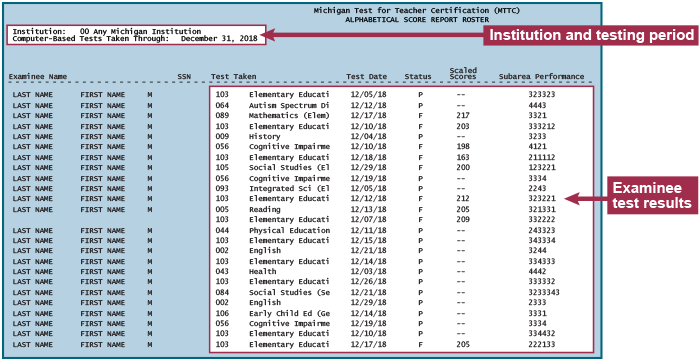
The title line says Michigan Test for Teacher Certification (MTTC), Alphabetical Score Report Roster. The next two lines say Institution: 00 Any Michigan Institution and Computer-Based Tests Taken Through: December 31, 2018. A callout identifies these two lines as the Institution and testing period.
The body of the report is a table. The first three columns are the Examinee Name, listed as the last name, first name, and middle initial. All of the entries in the sample say LAST NAME, FIRST NAME, and M. On an actual form, the names would appear in alphabetical order by last name. The fourth column is for the last 4 digits of the examinee's social security number. All the entries in this sample are blank. The remaining columns are collectively identified by a red callout as the Examinee test results. The first two columns are the Test Taken, listed as the field number and name. Nine of the entries are 103 Elementary Education. Fifteen additional entries are for various other tests. The next column is the Status. Some entries appear as P and some appear as F. The next column is the Scaled Scores. The entries that have a P in the status column appear as two dashes. The entries that have an F in the status column appear as numbers ranging from 163 to 217. The last column is the Subarea Performance. All the entries include a series of numbers from four to seven digits long. Each entry includes some combination of the numbers 1 to 4, but not necessarily all of those numbers (for example, the series for the second entry has a 4, a 4, a 4, and a 3, while the series for the sixth entry has a 4, a 1, a 2, and a 1).
Use. This report may be useful in answering the following types of questions:
- Did examinee "LASTNAME FIRSTNAME" pass a specific test during the reporting period?
- If examinee "LASTNAME FIRSTNAME" did not pass, what was the examinee's scaled score?
Institution Roster by Test
Description. This report presents, by test, individual and summary score performance information for the educator preparation program as well as the state summary score performance for examinees who tested on the date or period indicated.
Individual examinee score information includes the following data:
- last four digits of the social security number
- test date
- examinee's pass/fail status
- scaled scores for tests and subtests not passed
- an indication of performance by subarea
Summary score information includes, for the educator preparation program and statewide, the following data:
- the number of examinees who tested
- the number and percentage who did and did not pass
- the percentage of examinees with subarea scaled scores of 220 or greater, by subarea
Test-level data reported are similar to what appears on examinee score reports, but in a more condensed format.
Sample Institution Roster by Test Report: Part 1
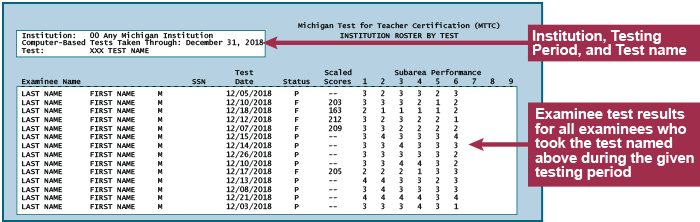
The title line says Michigan Test for Teacher Certification (MTTC), Institution Roster By Test. The next three lines say Institution: 00 Any Michigan Institution, Computer-Based Tests Taken Through: December 31, 2018, and Test: XXX TEST NAME. A callout identifies these three lines as the Institution, testing period, and test name.
The next block of information is identified by a red callout as the Examinee test results for all examinees who took the test named above during the given testing period.
The first three columns are the Examinee Name, listed as the last name, first name, and middle initial. All of the entries in the sample say LAST NAME, FIRST NAME, and M. On an actual form, the names would appear in alphabetical order by last name.
The fourth column is for the last 4 digits of the examinee's social security number. All the entries in this sample are blank.
The next column is the Test Date. All entries are various dates in December 2018. The next column is the Status. Each entry has either a P or an F.
The next column is the Scaled Scores. The entries that have a P in the Status column appear as two dashes. The entries that have an F in the Status column are numbers ranging from 163 to 212.
The final column is Subarea Performance. This column has sub-columns numbered 1 through 9. Each entry for each subarea from 1 through 6 is a numeral ranging from 1 to 4. The entries for subareas 7, 8, and 9 are blank.
Sample Institution Roster by Test Report: Part 2
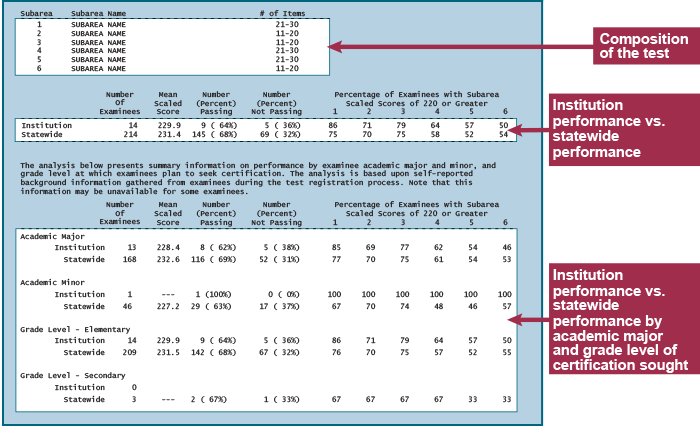
The first block of information is identified by a red callout as the Composition of the test. It has three columns.
The first column is the Subarea, and lists each subarea number. In this sample, there are entries for Subareas 1 to 6.
The second column is Subarea Name, and lists each subarea name. In this sample, each entry says SUBAREA NAME.
The third column is # of Items, and lists the range of item counts in that subarea. Subareas 1, 4, and 5 say 21 to 30. Subareas 2, 3, and 6 say 11 to 20.
The next block of information is identified by a red callout as the Institution performance versus statewide performance. The institution and statewide statistics are provided one above the other for easy comparison.
There are five columns: Number of Examinees; Mean Scaled Score; Number (Percent) Passing; Number (Percent) Not Passing; and Percentage of Examinees with Subarea Scaled Scores of 220 or Greater. The fifth column has 1 sub-column for each subarea of the test.
The remaining block of information is identified by a red callout as the Institution performance versus statewide performance by academic major and grade level of certification sought. At the top there is the following text: The analysis below presents summary information on performance by examinee academic major and minor, and grade level at which examinees plan to seek certification. The analysis is based upon self-reported background information gathered from examinees during the test registration process. Note that this information may be unavailable for some examinees.
Below this text there are the same five columns as for the preceding block of information, and the sub-columns in the fifth column are number 1 through 6. Each column provides institution and statewide statistics, one above the other, for the performance and certification grade level information identified in the text at the top.
Use. In addition to using individual examinee information, educator preparation programs may find the aggregated total test and subarea performance information valuable for identifying courses or curriculum areas that may need to be adapted to strengthen students' content knowledge. Using the test information, including subarea performance indices, along with the test objective-course alignment information in the Test Objective and Subarea Matching Worksheet for MTTC Tests ![]() may give you a broader understanding of the strengths and weaknesses of individual students and the curriculum.
may give you a broader understanding of the strengths and weaknesses of individual students and the curriculum.
ASCII data files
ASCII data files are made available to educator preparation programs for downloading and importing test results into their software databases or applications, allowing customized formatting and analysis of test scores. A readme file![]() on the secure website facilitates understanding of the data file formats (note that the format of the readme file shown here is effective beginning May 2017).
on the secure website facilitates understanding of the data file formats (note that the format of the readme file shown here is effective beginning May 2017).
Interpretive Cautions
When reviewing the reports and data for your educator preparation program, please keep in mind the interpretive cautions made available with each. The following is a list of typical cautions:
- Results based on smaller numbers of examinees are typically less stable than those based on larger numbers, and may not provide a reliable indication of how examinees at an educator preparation program typically perform.
- The performance of examinees for a particular test reporting period may not predict the performance of other examinees who take the tests in the future.
- Although examinees do not "pass" or "fail" individual subareas, subarea performance information available to examinees on their Individual Score Reports may be useful in understanding their areas of strength and weakness. This information should be interpreted with caution since subareas contain varying numbers of test items.
- Subarea performance information is based on fewer questions than the total test score and may be less reliable as an indication of performance.
- The individual examinee information contained in the program-level score reports is confidential and must not be disclosed to unauthorized persons or educator preparation programs. Appropriate safeguards must be implemented by all personnel to protect examinees from improper disclosure of information.
- Individual examinee results are intended to be used for the purpose of Michigan educator certification. The MTTC tests are not designed to be used for other purposes, including but not limited to employment decisions and admission to or completion of an educator preparation program.
- Examinee test results included in the institution reports are complete and accurate as of the date and time the report is released. Additions or changes to this information may occur after this date. The MDE maintains an updated file of official results for the purpose of certification.
Test Results Reported to the Michigan Department of Education (MDE)
Following each MTTC score reporting date, the MDE also receives score reports that include the following information:
- a statewide Alphabetical Score Report Roster
- a statewide summary report, providing aggregate results by test
- an ASCII file, from which individual examinee data are also uploaded to MOECS, the state's online education certification system, after each score reporting date
- updates to ResultsAnalyzer
Need More Time?
To continue your session, select Stay Signed In.
