Study Guide
Field 089: Mathematics (Elementary)
Sample Multiple-Choice Questions
Expand All Answers | Collapse All Answers
The following reference material will be available to you during the test:
Subarea 1—MATHEMATICAL PROCESSES AND NUMBER CONCEPTS
Objective 001
Understand principles of mathematical reasoning and techniques for communicating mathematical ideas.
1. Sixth-grade students are using a graphing calculator to explore how changing the value of m in an equation of the form y = mx changes the graph of the equation. The students view several graphs and are then asked to make a generalization about how the value of m affects the graph of the equation. This is an example of using:
- a counterexample to evaluate a mathematical relationship.
- an axiomatic system to generate a mathematical relationship.
- inductive reasoning to conjecture a mathematical relationship.
- deductive reasoning to prove a mathematical relationship.
- Enter to expand or collapse answer.Answer expanded
- Correct Response: C.
Objective 002
Understand problem-solving strategies, connections among different mathematical ideas, and the use of mathematical modeling to solve real-world problems.
2. Students measure the circumference and diameter of a number of circular objects and graph the circumference on the y-axis and the diameter on the x-axis. The students then draw a line that seems to best fit the data points. How can the students use their graphs to estimate the value of pi?
- find the length of the line
- find the slope of the line
- find the y-intercept of the line
- find the midpoint of the line
- Enter to expand or collapse answer.Answer expanded
- Correct Response: B.
Objective 003
Understand and apply concepts of proportional reasoning.
3. Use the diagram below to answer the question that follows.
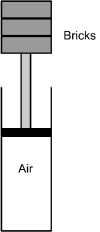
A piston is placed at the top of a cylinder filled with air. As shown in the diagram above, students place a total of three 2 kg bricks, one at a time, on top of the piston and measure the volume of air in the cylinder. Their data are given in the table below.
| Mass on Piston | Volume of Air in Cylinder (cubic centimeters) |
|---|---|
| 2.0 | 280 |
| 4.0 | 140 |
| 6.0 | 93 |
What would be the approximate volume of the air in cubic centimeters if students placed two more 2 kg bricks on top of the piston?
- 35
- 47
- 56
- 70
- Enter to expand or collapse answer.Answer expanded
- Correct Response: C.
Objective 004
Understand number systems and equivalent ways of representing numbers.
4. On a calculator, a student starts with 2 and takes the square root four times in succession. This is equivalent to calculating which of the following numbers?
- 2 to the 0 point 25 power


- Enter to expand or collapse answer.Answer expanded
- Correct Response: D.
Objective 005
Understand number theory and operations on number systems.
5. A class is using manipulative tiles in the shape of equilateral triangles to explore fractions. One of the students makes up the problem illustrated below.
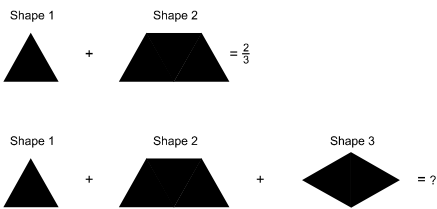
The illustration shows addition equations using shapes composed of unit equilateral triangles. In the first equation, shape 1 + shape 2 equals 2 thirds. Shape 1 is a unit equilateral triangle. Shape 2 is a trapezoid. The top and sides of Shape 2 are 1 unit in length, and the bottom is 2 units in length. In the second equation, shape 1 + shape 2 + shape 3 equals question mark. Shape 3 is a diamond. Each side of shape 3 is 1 unit in length. The text below the equations says, "If Shape 1 and Shape 2 equal 2 thirds, what does shape 1 + Shape 2 + Shape 3 equal?"
If Shape 1 and Shape 2 equal ⅔, what does Shape 1 + Shape 2 + Shape 3 equal?
What is the solution to this problem?

- 1


- Enter to expand or collapse answer.Answer expanded
- Correct Response: B.
Subarea 2—PATTERNS, ALGEBRAIC RELATIONSHIPS, AND FUNCTIONS
Objective 006
Describe, analyze, and generalize mathematical patterns.
6. The first two elements of a pattern are shown in the diagram below.
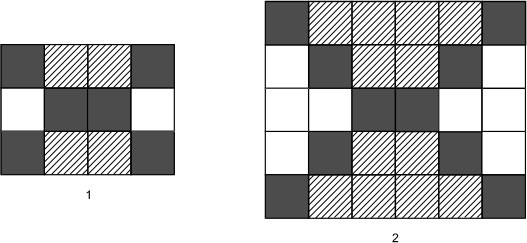
The first pattern is four squares by three squares. In the first row, the squares are black, gray, gray, black. In the second row, they are white, black, black, white. In the third row, they are black, gray, gray, black. The second pattern is six squares by five squares. In the first row, the squares are black, gray, gray, gray, gray, black. In the second row, they are white, black, gray, gray, black, white. In the third row, they are white, white, black, black, white, white. In the fourth row, they are white, black, gray, gray, black, white. In the fifth row, the squares are black, gray, gray, gray, gray, black.
If the pattern continues, how many black boxes will there be in the fifth element of the pattern?
- 16
- 18
- 20
- 22
- Enter to expand or collapse answer.Answer expanded
- Correct Response: D.
Objective 007
Use variables and symbolic expressions to describe and analyze patterns of change and functional relationships.
7. Use the diagram below to answer the question that follows.
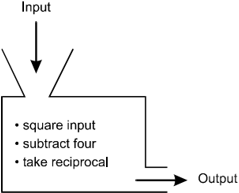
The diagram represents a function machine as the cross-section of a box with an input funnel at the top left and an output opening at the bottom right. The box contains a bulleted list of the following steps: square input, subtract 4, take reciprocal.
What is the domain of the function machine shown above?
- all real numbers
- all real numbers greater than –4
- all real numbers except 2 and –2
- all real numbers except 4 and –4
- Enter to expand or collapse answer.Answer expanded
- Correct Response: C.
Objective 008
Understand properties and applications of linear functions, and solve related equations and inequalities.
8. Use the diagram below to answer the question that follows.
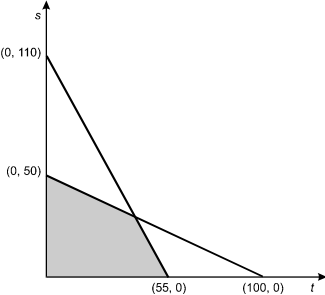
The diagram is a graph of vertical line s versus horizontal line t with two data lines. One data line goes from 0, 110 on s to 55, 0 on t, and the other goes from 0, 50 on s to 100, 0 on t. The area between the origin and the nearest segments of the two data lines is shaded.
If s ≥ 0, and t ≥ 0, which of the following systems of equations corresponds to the shaded portion of the graph?
- t + 2s ≤ 50
2t + s ≤ 55 - 2t + s ≤ 50
t + 2s ≤ 55 - 2t + s ≤ 100
t + 2s ≤ 110 - t + 2s ≤ 100
2t + s ≤ 110
- Enter to expand or collapse answer.Answer expanded
- Correct Response: D.
Objective 009
Understand properties and applications of quadratic functions, and solve related equations and inequalities.
9. A quadratic function h(x) has zeros at 4 and −3 and a y-intercept of −12. The function h(x) is translated 3 units to the left. Which of the following equations represents g(x), the transformed h(x)?
- g(x) = x2 − 5x
- g(x) = x2 + 7x
- g(x) = x2 − x − 15
- g(x) = x2 + 5x − 6
- Enter to expand or collapse answer.Answer expanded
- Correct Response: D.
Objective 010
Understand properties and applications of nonlinear functions and the conceptual foundations of calculus.
10. Use the table below to answer the question that follows.
| Year | Population |
|---|---|
| 0 | 50,000 |
| 1 | 51,000 |
| 2 | 52,020 |
| n | ? |
The table gives the population of a town over a three-year period. If the population continues to increase at the same rate per year, which of the following equations could be used to predict the population, P(n), in the nth year?
- P(n) = 50,000 + 500n
- P(n) = 50,000(0.02)n
- P(n) = 50,000 + 1,000n
- P(n) = 50,000(1.02)n
- Enter to expand or collapse answer.Answer expanded
- Correct Response: D.
Subarea 3—MEASUREMENT AND GEOMETRY
Objective 011
Understand attributes of measurement and measuring units.
11. Use the diagram below to answer the question that follows.
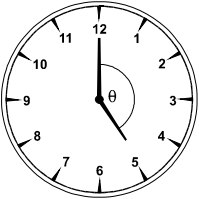
What is the measure of the angle θ between the two hands of an analog clock when the clock reads 5:00?
- 120°
- 150°
- 160°
- 175°
- Enter to expand or collapse answer.Answer expanded
- Correct Response: B.
Objective 012
Apply measurement principles to analyze the spatial characteristics of two- and three-dimensional shapes.
12. Use the diagram below to answer the question that follows.

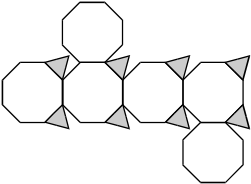
A truncated cube is a polyhedron formed by cutting the corners off a cube. Which of the following nets represents the truncated cube shown above?
Response A. There are 6 planes in a 2 by 3 grid. In the top row, the first 2 planes have triangles at their upper right corners, the first plane has a triangle at the lower left corner, and all of the planes have triangles at the lower right corners. In the second row, the first 2 planes have triangles at the lower right corners.
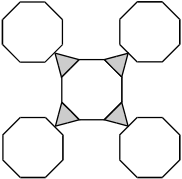
Response B. There are 4 planes in a 2 by 2 grid. In the first row, the first plane has a triangle at the upper right corner and a triangle at the lower left corner, and both planes have triangles at the lower right corners. In the second row, the first plane has a triangle at the lower right corner.
Response C. There are 4 planes connected in a horizontal row, with a plane connected above the second plane and another connected below the fourth plane. All of the planes in the horizontal row have triangles at the upper right and lower right corners.
Response D. There is one plane with a triangle at each corner and a plane at the outer tip of each triangle.
- Enter to expand or collapse answer.Answer expanded
- Correct Response: C.
Objective 013
Apply geometric principles of points, lines, angles, planes, congruence, and similarity to analyze the formal characteristics of two- and three-dimensional shapes.
13. Use the diagram below to answer the question that follows.
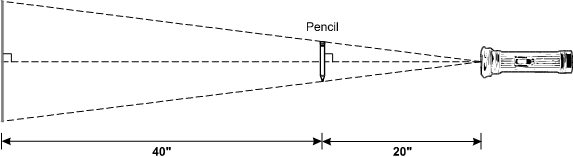
The diagram shows a flashlight with the beam directed at a vertical pencil 20 inches away. Dashed lines indicate the centerline of the beam, which is at a right angle to the pencil. Dashed lines also indicate paths from the center of the flashlight lens to the ends of the pencil and from there to a vertical wall 40 inches beyond the pencil, thus marking the upper and lower ends of the pencil's shadow on the wall.
A pencil 5 inches long is held between a wall and a flashlight creating a shadow on the wall as shown above. What is the length of the pencil's shadow in inches?
- 10
- 12
- 15
- 20
- Enter to expand or collapse answer.Answer expanded
- Correct Response: C.
Objective 014
Apply properties of geometric transformations and coordinate geometry to describe geometric objects in two and three dimensions.
14. Use the figures below to answer the question that follows.
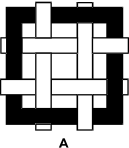
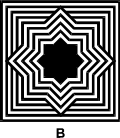
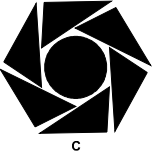

Figure A is a square black frame with 2 horizontal and 2 vertical white strips woven through it. The upper horizontal white strip is behind the left side of the black frame, in front of the first vertical white strip, behind the second vertical white strip, and in front of the right side of the black frame. The lower horizontal white strip is in front of the left side of the black frame, behind the first vertical white strip, in front of the second vertical white strip, and behind the right side of the black frame. The first vertical white strip is in front of the top side of the black frame and behind its bottom side. The second vertical white strip is behind the top side of the black frame and in front of its bottom side.
Figure B is a square pattern of concentric alternating black and white shapes. The outermost eight lines are squares. The remaining eight lines are eight-pointed stars, as would result from placing a square rotated 45 degrees concentrically on top of another square. The upper, lower, right, and left points of these squares overlap and obscure parts of the outermost lines.
Figure C is a circle with 6 right triangles arranged around it with the hypotenuse of each triangle nearly touching the circle, and the vertex between the hypotenuse and the short side nearly touching the center of the hypotenuse of the next triangle, such that the long sides of the triangles form a hexagon around the circle.
Figure D is a black square superimposed with a white frame. A white bar passes through the white frame from the lower left corner of the black square to its upper right corner. The bar passes in front of the lower left corner of the white frame and behind its upper right corner.
Which of the figures above has both reflective and rotational symmetry?
- Figure A
- Figure B
- Figure C
- Figure D
- Enter to expand or collapse answer.Answer expanded
- Correct Response: B.
15. Use the table below to answer the question that follows.
| Vertex | Coordinates |
|---|---|
| E | (0, 2, 2) |
| F | (6, 2, 2) |
| G | (6, 2, 0) |
| H | (6, 0, 0) |
The x-y-z-coordinates of four of a rectangular solid's vertices are given in the table. What is the surface area of this solid?
- 24
- 40
- 56
- 72
- Enter to expand or collapse answer.Answer expanded
- Correct Response: C.
Subarea 4—DATA ANALYSIS, STATISTICS, PROBABILITY, AND DISCRETE MATHEMATICS
Objective 015
Understand methods of organizing, displaying, analyzing, and interpreting data.
16. Use the diagram below to answer the question that follows.
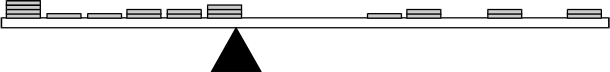
The diagram shows the cross-section of a straightedge with pennies placed on top. At the left end of the straightedge there are 6 piles of pennies, side by side. From the left, the piles have 4, 1, 1, 2, 2, and 3 pennies. At the right end of the straightedge are 4 piles of pennies, with gaps a penny wide, or piles of 0 pennies, between some piles. From the right end, the piles have 2, 0, 2, 0, 2, and 1 pennies. Between the last pile from the left and the last pile from the right, there is a gap slightly larger than 3 pennies wide. The whole is balanced on the tip of a triangular shape. The tip of the triangle is located under the right edge of the sixth pile of pennies from the left.
In a unit on measures of central tendency, a middle school math teacher places 20 pennies on top of a straight edge. She then balances the straight edge on a triangular block. Which of the following measures of central tendency is most analogous to the point at which the straight edge balances?
- variance
- mean
- mode
- median
- Enter to expand or collapse answer.Answer expanded
- Correct Response: B.
17. Use the diagram below to answer the question that follows.
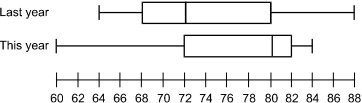
The diagram shows two box and whisker plots above a number line labeled from 60 to 88 in increments of 2. The upper plot is labeled "Last Year." It has ends at 64 and 88. The ends of the box are at 68 and 80. The vertical line inside the box is at 72. The lower plot is labeled "This Year." It has ends at 60 and 84. The ends of the box are at 72 and 82. The vertical line inside the box is at 80.
The plots above display state assessment results. Based on these plots, which of the following is an accurate statement to report to parents?
- Unfortunately, our scores this year were not as high as last year. This year a higher percentage of students than last year had raw scores below 72.
- Unfortunately, our scores this year were not as high as last year. Last year a higher percentage of students scored above 82.
- Fortunately, our scores this year improved. The percentage of students in the interquartile range increased this year.
- Fortunately, our scores this year improved. Seventy-five percent of our students scored at or above last year's median.
- Enter to expand or collapse answer.Answer expanded
- Correct Response: D.
Objective 018
Understand principles of discrete mathematics.
18. A student is using a computer program to graph the equation of a line in the form y = mx + b. If both m and b are elements of the set {1, 2, 3}, how many distinct lines can be drawn?
- 3
- 6
- 8
- 9
- Enter to expand or collapse answer.Answer expanded
- Correct Response: D.
Objective 016
Understand methods of collecting data and making predictions and inferences based on data.
19. A newspaper is planning to conduct a poll to determine what percentage of the registered voters in a community supports the proposed school budget for the next year. In designing the poll, the newspaper's staff should recognize that increasing the number of people included in the survey will:
- strengthen the null hypothesis.
- narrow the confidence interval reported.
- increase the statistical significance of the results.
- reduce the randomness of the sample.
- Enter to expand or collapse answer.Answer expanded
- Correct Response: B.
Objective 017
Understand the theory of probability and probability distributions.
20. Friendly Farms, Inc., has several farms. Over the years, it has been determined that the probability of sufficient rain during the maximum growth period is 25%. When there is not enough rain, Friendly Farms needs to supplement with irrigation. The profit when there is sufficient rain during the maximum growth period is $4000 per acre. If it does not rain during this period, the profit is only $1600 per acre. Using this information, what profit per acre, on average, can Friendly Farms expect to make?
- $1000
- $2200
- $2800
- $3400
- Enter to expand or collapse answer.Answer expanded
- Correct Response: B.