Study Guide
Field 022: Mathematics (Secondary)
Sample Multiple-Choice Questions
Expand All Answers | Collapse All Answers
The following reference material will be available to you during the test:
Subarea 1—MATHEMATICAL PROCESSES AND NUMBER CONCEPTS
Objective 001
Understand principles of mathematical reasoning and techniques for communicating mathematical ideas.
1. Use the graph below to answer the question that follows.
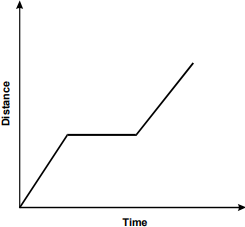
The graph is a line graph. The vertical axis is labeled Distance, and the horizontal axis is labeled Time. The data line ascends at a sharp upward angle from the origin, becomes horizontal for a certain distance, then resumes a sharp upward angle.
Students in a class are making qualitative graphs of their motion as they move along a straight line. Which of the following statements best describes the motion represented in the distance versus time graph above?
- The student accelerated to a certain speed, walked at that speed for a period of time, and then started accelerating again.
- The student started walking at a constant speed, then stopped for a while before continuing at approximately the same speed.
- The student walked along a straight line, turned right, continued walking in a straight line, turned left, and then continued walking in a straight line.
- The student started speeding up, stopped for a period of time, and then resumed walking at a faster and faster speed.
- Enter to expand or collapse answer.Answer expanded
- Correct Response: B.
Objective 002
Understand problem-solving strategies, connections among different mathematical ideas, and the use of mathematics in other fields.
2. While studying transformations of geometric figures, the students in a geometry class made the following observations about rotations of geometric figures.
The composition of two rotations with the same center is a rotation.
If R1, R2, and R3 are rotations with the same center, then (R1 times R2) times R3 = R1 times (R2 times R3)
Rotation by an angle theta = 0 leaves any object unchanged.
For every rotation there exists an inverse rotation that undoes the effect of the initial rotation.
A teacher could use these observations to show the connections between geometry and algebra by discussing which of the following algebraic structures?
- groups
- fields
- rings
- vector spaces
- Enter to expand or collapse answer.Answer expanded
- Correct Response: A.
Objective 003
Understand number systems and equivalent ways of representing numbers.
3. Use the sets below to answer the question that follows.
| U = {x| x is a real number} and | |
S = {x| x is of the form
 (b not equal to 0) where a and b are integers}
|
Which set is the complement of S?
- {x| x is a prime number}
- {x| x is an irrational number}
- {x| x is a real number}
- {x| x is an integer}
- Enter to expand or collapse answer.Answer expanded
- Correct Response: B.
Objective 004
Understand number theory and operations on number systems.
4. Use the diagram below to answer the question that follows.
| x squared | 8x |
| 2x | 16 |
The diagram above is a geometric representation of which of the following operations?
- the sum of (x + 4) squared and 10x
- the difference of (x minus 4) squared and 2x
- the product of (x + 2) and (x + 8)
- the quotient of x squared + 16 and 10x
- Enter to expand or collapse answer.Answer expanded
- Correct Response: C.
Subarea 2—PATTERNS, ALGEBRAIC RELATIONSHIPS, AND FUNCTIONS
Objective 005
Describe, analyze, and generalize mathematical patterns.
5. Use the diagram below to answer the question that follows.

In the sequence of rectangles shown above, the first rectangle is a square of area one. Each successive rectangle has the same base, but has two-thirds the height of the previous rectangle. If this pattern is continued indefinitely, which series represents the sum of the areas of all the rectangles?
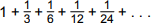
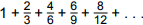
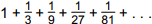
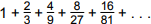
- Enter to expand or collapse answer.Answer expanded
- Correct Response: D.
Objective 006
Use symbolic expressions to describe and analyze patterns of change and functional relationships.
6. Use the graphs of the functions below to answer the question that follows.
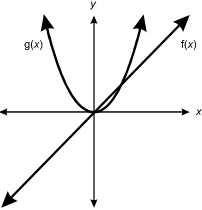
Two functions are plotted on an x, y graph. F of X is a straight line through the origin at a 45° angle, sloping upward to the right. G of X curves upward in a U shape from the origin.
Given the two functions above, which of the following graphs represents the sum of the two functions?
-
 A single date line on an X, Y graph curves upward in a U shape from a point below the X axis and to the left of the Y axis.
-
 A single date line on an X, Y graph curves upward in a U shape from a point below the X axis and to the right of the Y axis.
-
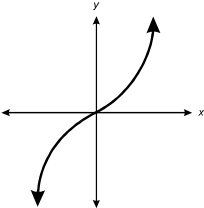 From the origin, a single data line on an X, Y graph curves upward to the right at an increasingly steep slope and similarly downward to the left.
-
 From the origin, a single data line on an X, Y graph curves upward to the right at an increasingly shallow slope and similarly downward to the left.
- Enter to expand or collapse answer.Answer expanded
- Correct Response: A.
Objective 007
Understand properties and applications of linear and quadratic functions, and solve related equations and inequalities.
7. Use the table below to answer the question that follows.
| Location | Altitude (feet) | Boiling Point of Water ( degreesF) |
|---|---|---|
| Sea Level | 0 | 212 |
| Denver, CO | 5,000 | 203 |
The temperature at which water boils is a function of altitude above sea level. How well does a linear model based on the data in the table predict the temperature (160 degrees F) at which water boils on Mt. Everest (height = 29,000 feet)?
- very well, with an error less than 1%
- sufficiently well, with an error of about 4%
- good enough for a rough estimate, with an error of about 8%
- very poorly; a linear model should not be used to characterize this relationship
- Enter to expand or collapse answer.Answer expanded
- Correct Response: A.
8. Use the diagram below to answer the question that follows.
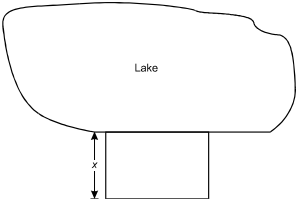
At the bottom, a portion of the outline forms a straight line. A portion of this straight shoreline forms one long side of a rectangle adjoining the lake. One short side of the rectangle is dimensioned X.
A person is fencing in three sides of a rectangular region using the straight part of a lake shoreline as the fourth side of the region. No fencing is required for the fourth side. The person has 110 meters of fencing, and the area of the region is 1,200 square meters. Which of the following quadratic equations should be solved to find the value of x?
- x squared + 110x + 1200 = 0
- x squared minus 55x + 600 = 0
- x squared minus 55x + 1200 = 0
- x squared minus 110x + 600 = 0
- Enter to expand or collapse answer.Answer expanded
- Correct Response: B.
Objective 008
Understand properties and applications of polynomial, rational, radical, exponential, logarithmic, and trigonometric functions, and solve related equations and inequalities.
9. A wildlife biologist discovers that a bird population in a certain area is being reduced by half every 6.3 years. The population will be unable to sustain itself if it drops below its lower limit of viability, which is 1,500. If the original population of birds is 5,000, how long will it take for the population to reach its lower limit of viability?
- 6.3 years
- 8.8 years
- 10.9 years
- 11.3 years
- Enter to expand or collapse answer.Answer expanded
- Correct Response: C.
10. An engineer would like to find the lowest degree polynomial that passes through the points (negative 4, 0), (negative 2, 0), (1, 0), and (3, 0). Which of the following functions satisfies the engineer's requirement?
- f(x) = (x minus 4)(x minus 2)(x + 1)(x + 3)
- f(x) = (x + 4)(x + 2) + (x minus 1)(x minus 3)
- f(x) = (x + 4)(x + 2)(x minus 1) + (x minus 3)
- f(x) = (x + 4)(x + 2)(x minus 1)(x minus 3)
- Enter to expand or collapse answer.Answer expanded
- Correct Response: D.
Objective 009
Understand principles and applications of differential and integral calculus.
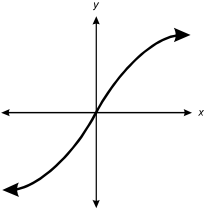
11. Use the graph below to answer the question that follows.
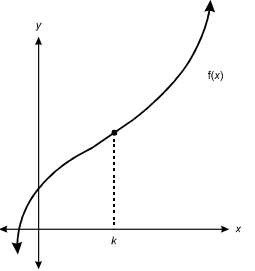
F of X is plotted on an X, Y graph. The data line curves in a reverse S shape beginning in the lower left quadrant, passing through the X axis, then through the Y axis, then upward through the upper right quadrant at an increasingly steep angle. To the right of the Y axis, a vertical dashed line is drawn from point K on the X axis to the data line.
If f(x) = ax3 + bx2 + cx + d, which of the following equations should be solved to find the value of k?
- 6ax + 2b = 0
- 3ax squared + 2bx + c = 0
- ax cubed + bx squared + cx + d = 0
- ax to the power of 4 over 4 + b x cubed over 3 + c x squared over 2 + dx + e = 0

- Enter to expand or collapse answer.Answer expanded
- Correct Response: A.
Subarea 3—MEASUREMENT AND GEOMETRY
Objective 010
Understand attributes of measurement and measuring units.
12. Use the diagram below to answer the question that follows.
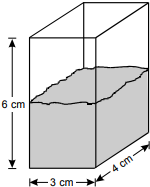
When an irregularly shaped object of mass 22.0 g is dropped into the rectangular container shown above, the object sinks to the bottom and the water level rises 1.5 cm. What is the density of the object, rounded to the nearest tenth?
- 0.8 g/cm cubed
- 1.2 g/cm cubed
- 1.8 g/cm cubed
- 14.7 g/cm cubed
- Enter to expand or collapse answer.Answer expanded
- Correct Response: B.
Objective 011
Apply measurement principles to analyze the spatial characteristics of two- and three-dimensional shapes.
13. Use the diagram below to answer the question that follows.
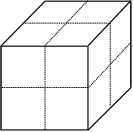
A cube has a surface area of 216 square inches. The dotted lines shown bisect the sides of the cube. Each side of the cube is sliced along the dotted lines to produce a number of smaller cubes. What is the sum of the surface areas of all the cubes produced?
- 216 in. squared
- 432 in. squared
- 864 in. squared
- 2,592 in. squared
- Enter to expand or collapse answer.Answer expanded
- Correct Response: B.
Objective 012
Apply geometric principles of points, lines, angles, planes, congruence, and similarity to analyze the formal characteristics of two- and three-dimensional shapes.
14. Use the diagram below to answer the question that follows.
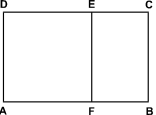
Rectangles ABCD and BCEF are similar, AF = AD, and line segment EF is perpendicular to line segment AB. If AB = 1 and FB = x, which of the following equations must be true?
- x squared minus x + 1 = 0
- x squared minus 2x minus 2 = 0
- x squared minus 2x + 2 = 0
- x squared minus 3x + 1 = 0
- Enter to expand or collapse answer.Answer expanded
- Correct Response: D.
Objective 013
Apply properties of geometric transformations and coordinate and vector methods to describe geometric objects in two and three dimensions.
15. Use the diagram below to answer the question that follows.
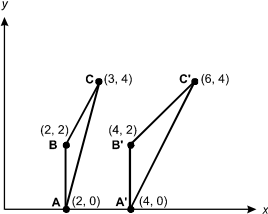
The diagram is an X, Y graph with 2 triangles plotted on it. The first is triangle ABC, with the following vertices: Point A (2, 0), Point B (2, 2), and Point C (3, 4). The second is triangle A prime, B prime, C prime, with the following vertices: Point A prime (4, 0), Point B prime (4, 2), and Point C prime (6, 4).
The transformation T maps each point on triangle ABC to a point on triangle A'B'C'. Which matrix represents T?


- Enter to expand or collapse answer.Answer expanded
- Correct Response: C.
Subarea 4—DATA ANALYSIS, STATISTICS, PROBABILITY, AND DISCRETE MATHEMATICS
Objective 014
Understand methods of collecting, organizing, and displaying data.
16. A group of high school students is planning a survey to determine the type of music students in their school listen to. To obtain the most statistically valid results, which of the following data collection techniques should the students employ?
- Questionnaires should be made available at all study halls for students to fill out and hand in at their own convenience.
- A sample of students should be chosen at random from class lists and interviewed individually.
- Students seen listening to music with headphones or other devices should be interviewed about what type of music they like.
- The students in the group should ask their friends about the types of music they prefer.
- Enter to expand or collapse answer.Answer expanded
- Correct Response: B.
Objective 015
Understand methods of describing, analyzing, and interpreting data.
17. When a set of data (x, y) is plotted on a standard coordinate system, the data points essentially lie on the arc of a nonlinear curve. When the data are transformed by taking the natural logarithm of the y-values and graphed as (x, ℓn y), the transformed data are close to lying on a straight line. This indicates the initial data would be best modeled by:
- an exponential function.
- a quadratic function.
- a rational function.
- a square root function.
- Enter to expand or collapse answer.Answer expanded
- Correct Response: A.
Objective 016
Understand methods of making predictions and inferences based on data.
18. An instructional computer simulation starts with a population consisting of {0, 1, 2, 3, 4, 5, 6, 7, 8, 9}. The mean of this population is 4.5 with a standard deviation of 2.87. The computer determines the mean of each of the 252 samples of size 5 and displays the distribution of the sample means as a histogram. The computer then compares this histogram with a normal curve having mean of 4.5 and standard deviation of 2.87 over square root of 5. What is the primary purpose of this demonstration?

- to demonstrate the central limit theorem
- to compare and contrast the mean and the median of a distribution
- to demonstrate how to find standard z scores for the normal curve
- to demonstrate the effect of data transformations on the mean and standard deviation
- Enter to expand or collapse answer.Answer expanded
- Correct Response: A.
Objective 017
Understand the theory of probability and probability distributions.
19. A target consists of a circle inscribed in a square. If a dart is randomly thrown at the square, what is the probability to the nearest thousandth that it will land inside the inscribed circle (assume the dart lands inside the square)?
- 0.318
- 0.637
- 0.785
- 0.858
- Enter to expand or collapse answer.Answer expanded
- Correct Response: C.
Objective 018
Understand principles of discrete mathematics.
20. A volunteer organization has set up a phone tree to reach all of its members quickly. In level one of the tree, the first person calls three members of the organization. In level two, each of the three people call three other members. If this patterns continues, how many people would have been called after n levels?
- 3 to the nth power
- n to the third power
-

-

- Enter to expand or collapse answer.Answer expanded
- Correct Response: D.